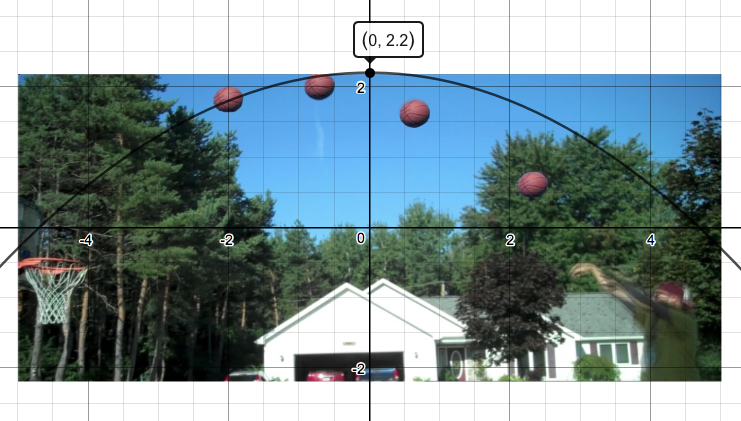
Based on the flight of the ball, I don't think the ball will make it in the hoop. It could however hit the backboard and then go in. This shot will not be nothing but net.
|
Based on the flight of the ball, I don't think the ball will make it in the hoop. It could however hit the backboard and then go in. This shot will not be nothing but net.
0 Comments
Type of Function: Exponential, because it gradually increases upwards
Domain of this function: 0<X<7 (equal sign) Range of this Function: 0<y<10 (equal sign added) The future of the graph will start to decline because ITunes grew their market share that year, taking away business from the others. It would not effect range for years because 10 would still be the maximum. However the domain would change because time would continue to move on. There would be a problem trying to extend the equation however because it is not a continuous growth so it would no longer be exponential. Making predictions based on trends is very difficult because no matter how hard you try, you cannot predict the future. The human error alone in this graph changes it drastically. 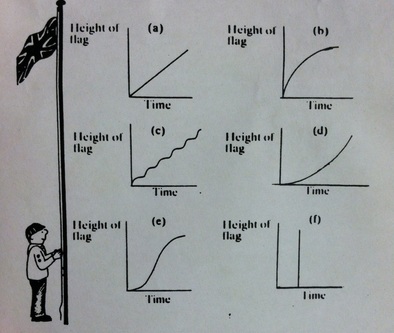 Each graph show how the flag is being raised compared to the time. You need to determine the most logical way of raising the flag at the correct speed. "A" means that there is a gradual increase in both time and high and that they are the most comparable. "B" gradually increase but then suddenly stops as it were platueing. " C" fluctuates as height and time goes up similar to "A", but in not such an efficient way. "D" takes time to raise, it wouldn't be as impactful as any of the others. "E" is a combination of "d" and "b", where it it takes time and then gradually stops. "F" just goes straight up but takes time to do so.
Originally I thought "F" would be the most realistic but after looking at the at graphs more, "A" is the most practical. You want the one where and height and speed are the most comparable. As time goes on the flag should be increasing at the same time. Probably "F". Time didn't not move as it went up, therefor it is impossible because no time has passed. |
AuthorWrite something about yourself. No need to be fancy, just an overview. Archives
November 2016
Categories |
 RSS Feed
